The problem isn't that design lacks value. It's that proving design ROI to a scientist-investor requires a completely different proof language than the conversion-rate deck a consumer brand would use. A program officer reviewing an ARPA-E application doesn't care about bounce rate. They care about whether your technology is legible enough to fund.
This post breaks down how to define, calculate, structure, and defend design ROI specifically for stakeholders who evaluate everything through a technical or financial-rigor lens.
TL;DR: key takeaways
- Design ROI in climate and deep tech shows up as fundraising speed, technical credibility, and partnership wins, not aesthetics
- Define your ROI type (financial, operational, strategic) before presenting to avoid mismatched expectations
- Pair quantitative metrics with qualitative signals like clarity and trust, matched to your audience
- Structure every pitch as problem → action → measurable outcome → specific ask
1. Why design ROI is harder to prove in climate & deep tech
Technical stakeholders default to the frameworks they already trust: peer-reviewed validation, technology readiness levels, levelized cost of energy, permitting timelines. Design spend doesn't map cleanly to any of those, so it feels unaccounted for unless someone ties it directly to a number they're already tracking.
That mismatch has real consequences. When fundraising crunches hit, design budgets often get cut first, even when design is the thing making the science comprehensible to the person writing the check.
McKinsey's Business Value of Design study tracked 300 public companies over five years and found that top-quartile design performers achieved 32 percentage points higher revenue growth and 56 percentage points higher shareholder returns than their industry peers.
That evidence still needs sector translation. The study covered medical technology, consumer goods, and retail banking, not climate or deep tech, so the number rarely lands cold with a hydrogen or carbon-capture founder.
1.1 When the technology itself isn't visual
Carbon capture, green hydrogen, and grid interconnection don't have an obvious visual language. There's no product screenshot that explains "roughly 97% CO2 capture from industrial flue gas."
When What if Design worked with Susteon, a climate-tech company spanning carbon capture, hydrogen production, and CO2 management, the brief itself was the hard part.
The team built a visual storytelling system: diagrams, interactive elements, and simple animations, to explain atmospheric CO2 concentration, point-source capture, and conversion of CO2 into sustainable aviation fuel.
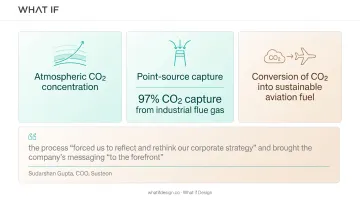
Sudarshan Gupta, COO of Susteon, Sudarshan Gupta, said the process "forced us to reflect and rethink our corporate strategy" and brought the company's messaging "to the forefront."
1.2 Different boards track different numbers
A SaaS design pitch leans on conversion rate and bounce rate. A climate tech board cares about:
- Investor comprehension speed during diligence
- Friction in the technical due-diligence process
- Partnership and pilot-agreement close rates
Design ROI conversations fail most often because the metrics on the slide don't match what the room already measures success by, not because the design didn't matter.
2. Defining the right type of ROI before you present
Before you build a single slide, decide which type of ROI you're actually showing. Presenting a financial number to a board expecting operational efficiency data is how credibility gets lost fast.
| ROI Type | Climate/Deep Tech Example | What It Proves |
|---|---|---|
| Financial | Faster funding round close | Direct capital impact |
| Operational | Fewer revision cycles with technical SMEs | Time and bandwidth saved |
| Strategic | Credibility with regulators or grant bodies | Long-term positioning |
Whichever type you choose, long-term framing matters more here than in typical marketing contexts. Multi-year grant cycles and slow pilot-to-scale timelines mean the payoff from a rebrand or website overhaul may not show up in a quarterly metric. It shows up in the next grant cycle, or the next investor conversation.
2.1 Modeled vs. measured ROI
Pre-revenue climate startups rarely have measured, post-launch results to point to. That's fine, but it needs to be named:
- Modeled ROI is projected impact, use it in early-stage pitches when you forecast what clarity will do for close rates
- Measured ROI is post-funding, post-launch data, such as applicant increases or faster pipeline speed
Say which one you're presenting. Stakeholders who evaluate through a financial-rigor lens will ask, and getting caught without an answer undermines the whole deck.
3. Calculating design ROI: A framework with real metrics
💡 Working through this decision right now? If you're a climate-tech or deep-tech founder weighing this trade-off, Book a strategy call with our team, 25 minutes, no pitch, and we'll pressure-test your specific situation.
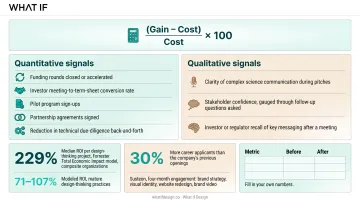
The standard formula is simple: (Gain − Cost) / Cost × 100. The math was never the hard part. Defining "gain" in terms a technical stakeholder will accept is.
Quantitative metrics that land with this audience:
- Funding rounds closed or accelerated
- Investor meeting-to-term-sheet conversion rate
- Pilot program sign-ups
- Partnership agreements signed
- Reduction in technical due-diligence back-and-forth
See how we have approached this in practice: Mobile UX design.
Qualitative metrics that convert into indirect financial estimates:
- Clarity of complex science communication during pitches
- Stakeholder confidence, gauged through follow-up questions asked
- Investor or regulator recall of key messaging after a meeting
Once you know which gains to track, boards still ask what "good" looks like outside your own data. Forrester's Total Economic Impact model projected a 229% median ROI per design-thinking project, with mature practices producing 71 to 107% modeled ROI. That figure comes from composite organizations, not climate tech specifically, but it gives stakeholders a reference point when they ask "compared to what?"
Proof lands harder when it sits next to your own category. Akhila Kosaraju, co-founder of What if Design, has worked with teams backed by the U.S. Department of Energy, ARPA-E, and leading climate VCs across carbon capture, grid interconnection, and green hydrogen, collectively raising over $105M.
The Susteon engagement is one documented case: a four-month project covering brand strategy, visual identity, website redesign, and a brand video. The redesign produced 30% more career applicants than the company's previous openings. A direct signal that clearer external communication changes how outside audiences respond.
To build your own case, track a simple before/after table like this one:
| Metric | Before Design Investment | After Design Investment |
|---|---|---|
| Time to explain core technology in a pitch | (your baseline) | (your result) |
| Investor clarification emails per deck sent | (your baseline) | (your result) |
| Turnaround time on updated pitch materials | (your baseline) | (your result) |
Fill it with your own numbers. A blank template with real internal data will always beat a borrowed statistic.
4. Structuring a design ROI presentation that stakeholders trust
Open with an executive summary slide: one headline number, one sentence of context. If a board member reads only that slide, they should still understand the case.
Then walk the causal chain explicitly, so nobody has to fill in the gaps:
- Describe the before state - confusing technical narrative, slow investor pipeline, inconsistent materials across pitch decks and the website
- Show the design action taken - what changed (brand system, pitch narrative, product UX) and why it targeted that friction
- Show the metric that moved - tied to something the room already tracks: pipeline velocity, close rate, grant conversion
- State the outcome - funding closed, pilot signed, applicant pool grew
Investment → Design Action → Metric Change → Outcome. Never leave a gap in that chain for the audience to fill in themselves.
Visual principles that matter here:
- Put the headline figure at the top of the slide, not buried in a paragraph
- Use bar charts for comparisons and line charts for trends across funding or grant cycles
- Keep color coding consistent: one color for gains, one for costs, on every slide
Keep the underlying number the same; adjust only the framing for who is in the room:
- Investors: growth and exit potential
- Technical co-founders: efficiency and rigor
- Boards: risk mitigation and predictability
Close with a specific, fundable ask. Not "design has been valuable," but "approve continued design partnership through Series A close" or "fund a rebrand ahead of the next grant cycle." A number without an ask is just trivia.
5. Handling investor & board objections about design spend
"Design is just aesthetics." Reframe it: design is the translation layer that makes complex science fundable. A BCG and Hello Tomorrow survey of 116 deep-tech ventures and investors found that 81% of deep-tech ventures believe investors lack the scientific or engineering expertise needed to assess their technology properly.
That's exactly the gap design closes.
On attribution, be honest. Design isn't the sole driver of a closed round or signed partnership. Say that directly. Then show the correlation data you do have: applicant lift after a rebrand, or faster material turnaround during a raise. Overclaiming causation destroys credibility faster than underclaiming it.
On variability, present a range, not a single number. Climate and deep tech results surface over longer horizons than a typical marketing timeline, shaped by grant cycles and pilot-to-scale progress. Give both cases:
- Conservative: reduced clarification cycles and clearer materials for the next funding conversation
- Optimistic: measurably faster close, stronger applicant pipeline, and regulator confidence carried into the next grant cycle
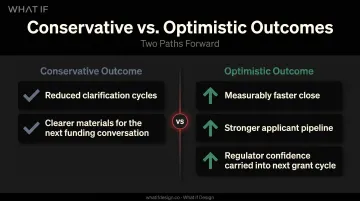
A range signals rigor. A single fixed number, in a room full of scientists, invites skepticism instead of trust.
Clarity here is what turns a defensive conversation into a confident one. Get a free strategic audit.
6. Frequently asked questions
6.1 How do you present design ROI?
Define the ROI type you're showing, connect it to one specific business outcome, and present a clear before/after metric. End with a defined ask tied directly to that number.
6.2 Is roughly 30% a high ROI?
There's no universal threshold, but many benchmarks treat any positive, double-digit return as solid. Forrester's modeled design-thinking projects showed roughly 229% median ROI, so roughly 30% is reasonable but not exceptional by that bar. Sector context still matters more than the raw number.
6.3 What metrics prove design ROI for climate tech or deep tech startups?
Funding velocity, investor meeting-to-term-sheet conversion, pilot program sign-ups, and reduced technical due-diligence friction are the sector-relevant proof points. Applicant growth after a rebrand is another underused signal.
6.4 How do you calculate the ROI of a design project?
Use (Gain − Cost) / Cost × 100. The formula itself is easy; clearly defining "gain" in terms your stakeholders already track is the important step.
6.5 How do you present design ROI to stakeholders who don't have a design background?
Use plain language, before/after visuals, and tie the story to numbers they already watch, like funding timelines or pipeline speed. Skip design jargon entirely.
6.6 What is a good ROI benchmark for design investment?
A positive ROI is the minimum bar. Forrester's TEI research cites 71 to 107% ROI for mature design practices. That figure is from a modeled study, not a climate tech-specific dataset, so treat it as a reference point rather than a guarantee.
Ready to take the next step?
If you're weighing a design partner for climate, deep tech, or hard-to-explain products, Book a strategy call with our founders at What if Design, a no-pressure 25-minute conversation about what you're building and where design can help. You can also View our work to see how we've helped teams like yours, or Get a free strategic Audit of your current brand, website, or product experience.