Few stop to ask why the same ad budget converts fewer customers than it used to. The answer is often sitting in plain sight: a slow landing page, a confusing sign-up flow, an onboarding experience that loses users before they see any value.
UX investment works differently than ad spend. A media buy resets every month. A UX fix, once shipped, keeps paying down your CAC on every dollar you spend afterward. This article covers the math linking UX to CAC, the specific levers with the biggest impact, how to calculate ROI on a UX project, and where to start.
TL;DR: key takeaways
- CAC = ad spend ÷ conversion rate: raise conversion and you cut CAC without touching ad budget
- Traditional CAC formulas ignore "Product CAC": the UX that decides whether marketing spend converts at all
- Small UX fixes (page speed, onboarding, mobile) compound into lasting CAC reductions, not one-off wins
- UX is a one-time or periodic cost that keeps paying down CAC for years, unlike recurring ad spend
- The right design partner builds this advantage without in-house UX team overhead
1. What is CAC, and why does UX belong in the formula?
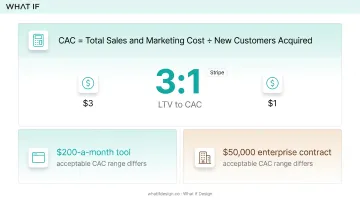
CAC is simple on paper: total sales and marketing cost divided by new customers acquired. Stripe, which processes payments for thousands of SaaS businesses, defines CAC this way and cites a general target of roughly 3:1 for LTV to CAC.
Healthy SaaS companies aim for about $3 of lifetime value for every $1 spent acquiring a customer.
That benchmark isn't a hard rule. A $200-a-month tool and a $50,000 enterprise contract will have very different acceptable CAC ranges. But 3:1 remains the most widely referenced starting point for judging whether your acquisition math works.
1.1 The blind spot in how teams track CAC
Here's the problem: CAC has historically been treated as a marketing and sales metric. Budget flows into ads, SDR headcount, and campaigns. Meanwhile, the product experience that determines whether a paid click actually becomes a customer gets almost no acquisition budget at all.
That split creates a strange outcome. A company can spend $50,000 driving traffic to a landing page with a confusing value proposition and never trace the wasted spend back to the page itself. The dollars just look like "underperforming CAC," and the fix is usually more ad spend, not better design.
A more useful way to think about total acquisition cost:
- Marketing CAC: what you spend to generate traffic and leads
- Product CAC: what you spend on the UX that determines whether that traffic converts
Divide the combined total by acquired customers who actually stick around, and you get a fuller picture of what it really costs to win a lasting customer.
This isn't a standardized industry formula. Treat it as an internal model, not a benchmark you'll find quoted elsewhere. But it reframes UX spend as a direct acquisition input rather than a separate cost center marketing never sees.
2. The math: how UX improvements directly lower CAC
The core relationship is straightforward: CAC = ad spend ÷ conversion rate. Hold ad spend constant and double your conversion rate, and you cut your CAC in half. You're acquiring the same number of customers for half the cost per customer.
A simple comparison makes this concrete:
| Scenario | Monthly ad spend | Conversion rate | Customers acquired | CAC |
|---|---|---|---|---|
| Before UX fix | $20,000 | roughly 1% | 20 | $1,000 |
| After UX fix | $20,000 | roughly 2% | 40 | $500 |
Same budget. Same traffic. Half the CAC, simply because more of the same visitors convert.
2.1 Where conversion leaks actually happen
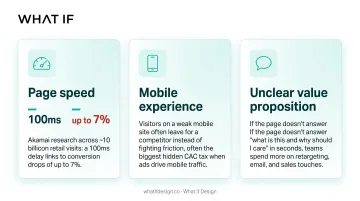
Three touchpoints tend to cause the most damage:
- Page speed. Akamai research across ~10 billion retail visits linked a 100ms delay to conversion drops of up to 7%. B2B funnels vary, but slow pages still bleed conversions before anyone reads your pitch.
- Mobile experience. Visitors on a weak mobile site often leave for a competitor instead of fighting the friction. When ads drive mobile traffic, this is often the biggest hidden CAC tax.
- Unclear value proposition. If the page doesn't answer "what is this and why should I care" in seconds, teams spend more on retargeting, email, and sales touches, costs a clearer above-the-fold message would avoid.
2.2 Why this makes UX one of the highest-ROI marketing investments
A media buy is rented, not owned. Stop paying, and the traffic stops. A UX fix is different: you pay for it once, and it keeps lowering your CAC on every future ad dollar for as long as that experience stays live. That's a different kind of investment than most items on a marketing budget.
3. Where UX investment cuts acquisition costs most over time
💡 Working through this decision right now? If you're a climate-tech or deep-tech founder weighing this trade-off, Book a strategy call with our team, 25 minutes, no pitch, and we'll pressure-test your specific situation.
The math above shows the immediate CAC effect. The bigger payoff shows up over months and quarters, as UX compounds through retention, referrals, and support costs.
3.1 Onboarding and time-to-value
The gap between sign-up and the moment a user experiences real value determines whether your acquisition spend actually turns into a retained customer. Slack's founder, in an interview with First Round Review, identified 2,000 team messages as the usage threshold after which 93% of teams kept using the product.
Design onboarding around a specific milestone, not a generic tutorial sequence. Teams that identify their own "aha moment" can build first-run experiences that push new users toward it deliberately, protecting acquisition spend from early churn instead of hoping users find value on their own.
3.2 The churn-to-CAC connection
Every customer who churns needs to be replaced to hit the same revenue target, and replacing them costs acquisition dollars all over again. A company with weak onboarding and confusing navigation doesn't just lose customers; it silently doubles up on acquisition spend, first to win the customer and again to replace them.
Reducing churn by even a modest amount has an outsized effect over a year, since churn compounds monthly. Fewer customers leaving means fewer replacement customers your ad budget needs to fund.
3.3 Word-of-mouth compounding
Some of the fastest-growing software companies barely rely on paid channels. Slack's own S-1 filing described growth as largely word-of-mouth, and Dropbox has said only a small share of its registered users came through paid marketing.
Most arrived through in-product referrals and sharing. Both companies front-loaded value delivery into the product experience itself, turning users into a distribution channel instead of a cost center.
3.4 The support-cost side effect
Confusing user journeys generate support tickets. Clear ones don't. Every ticket avoided is budget that can flow back into acquisition instead of firefighting user confusion: a second-order benefit that rarely shows up in a CAC spreadsheet but shows up in the P&L.
The compounding effect, summarized: each UX improvement doesn't lower CAC once. It hits several cost levers at the same time:
- Lowers churn, so you buy fewer replacement customers
- Lifts referrals, so users become a channel
- Cuts support drag, so budget returns to growth
Those benefits stack quarter over quarter instead of resetting like an ad campaign does.
Case study: Susteon
Susteon's carbon-capture-and-utilization work sits at the frontier of climate hardware, where the audience shifts from research partners to Fortune 500 procurement teams to strategic investors. We rebuilt their brand and website to communicate scientific depth without losing commercial legibility, a redesign that coincided with a 30% increase in career-page applicants. See the Susteon case study.
4. Calculating the ROI of a UX investment
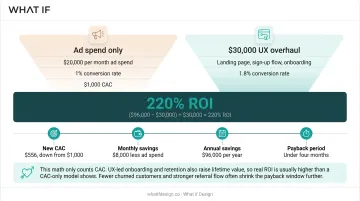
Here's a worked example. A company spends $20,000 a month on ads at a roughly 1% conversion rate, or a $1,000 CAC. It invests $30,000 in a UX overhaul (landing page, sign-up flow, onboarding) that lifts conversion to 1.roughly 8%.
The new math:
- New CAC: Same ad spend now yields about 1.8× the customers, so CAC falls to roughly $556 (down from $1,000)
- Monthly savings: At the same customer volume, about $8,000 less ad spend each month
- Annual savings: Roughly $96,000 per year
- ROI on the UX project: ($96,000 − $30,000) ÷ $30,000 = roughly 220% ROI
- Payback period: under four months
Treat this the way a CFO evaluates any capital investment: cost upfront, savings over time, a clear payback window.
One caveat: this math only counts CAC. UX-led onboarding and retention also raise lifetime value, so real ROI is usually higher than a CAC-only model shows.
Fewer churned customers and stronger referral flow often shrink the payback window further.
5. How to start investing in UX to lower CAC
You don't need a full redesign to improve CAC. Start narrow and prioritize fixes with the fastest CAC payback.
- Audit your highest-traffic, highest-drop-off touchpoints first: landing pages, sign-up flows, and first-run experience. Look at value proposition clarity, CTA visibility, form friction, load speed, mobile usability, and error messaging.
- Bring design in early, not after the product is already built. This matters most for technical or scientifically complex products, where the brief itself needs translating into a clear value proposition before any ad dollar gets spent explaining it.
- Treat UX as an ongoing budget line, not a one-off project. Review conversion rate, time-to-value, and churn alongside CAC every quarter, with the same rigor applied to marketing spend.
Those steps matter most when the product is hard to explain. Climate tech and deep-tech founders often sit on scientifically dense work: carbon-capture chemistry, grid-interconnection mechanics, and still need a value proposition someone grasps in five seconds.
What if Design was built around that translation problem. Founders Akhila Kosaraju and Tejas Mahajan work with DOE- and ARPA-E-backed teams and have contributed to over $105M raised across their client base.
If you don't want the overhead of a senior in-house hire, a design partnership can cover UX audits, subscription engagements with 2 to 4 day turnarounds, and equity-based options for earlier-stage teams. The point is senior-level strategy applied where it moves CAC, not polish for its own sake.
Clarity here is what turns a defensive conversation into a confident one. Get a free strategic audit.
6. Frequently asked questions
6.1 What is CAC and what does CAC reduction mean?
CAC is total sales and marketing spend divided by new customers won. CAC reduction means lowering that per-customer cost without sacrificing growth or lifetime value.
6.2 What is the relationship between CAC and CTR?
CTR only measures top-of-funnel clicks, while CAC captures the full cost through to a closed customer. A high CTR can still produce a high CAC if the post-click experience fails to convert those clicks.
6.3 What is a good CAC (or LTV:CAC)?
There isn’t a universal “good” CAC percentage. The standard benchmark is an LTV:CAC ratio of at least 3:1, and what counts as good still depends on industry, deal size, and payback period.
6.4 How long does it take for a UX investment to lower CAC?
Measurable conversion gains can appear within weeks of shipping changes. The full compounding effect through retention and referrals typically shows up over two to four quarters.
6.5 Is investing in UX worth it for an early-stage startup with a small budget?
Early-stage teams often see the highest ROI from UX, since fixing conversion leaks before scaling ad spend prevents compounding waste. Small, focused fixes usually beat a full redesign at this stage.
6.6 What UX metrics should teams track alongside CAC?
Track conversion rate by funnel stage, time-to-value, churn rate, and referral or word-of-mouth share. These four metrics explain most of the movement you'll see in CAC over time.
Ready to take the next step?
If you're weighing a design partner for climate, deep tech, or hard-to-explain products, Book a strategy call with our founders at What if Design, a no-pressure 25-minute conversation about what you're building and where design can help. You can also View our work to see how we've helped teams like yours, or Get a free strategic Audit of your current brand, website, or product experience.