Key Takeaways
- User research for climate tech and deep-tech products requires different approaches than standard UX guidance describes
- Every $1 invested in UX returns $100 in measurable outcomes, per Forrester research, but the methods need to fit the user population
- Qualitative methods reveal the "why" behind behavior; quantitative methods confirm how widespread a problem is
- Five users are enough for qualitative discovery; 30+ are needed for statistical significance
- Research only delivers value when findings connect directly to product and business decisions
- The most consistent mistake we see in climate tech products: recruiting participants from pilot customers rather than target buyers
1. What is user research in UX design?
Climate tech and deep-tech products share a specific failure pattern we encounter regularly. The technology works. The engineering is sound. Pilot results are promising. But when energy operators, grid engineers, or utility procurement managers sit down with the product, they're lost within minutes. Not because the technology fails, but because the experience was built around the development team's internal logic rather than how domain experts actually think and work.
This is not a generic UX problem. It's specific to products where the builders have deep technical expertise that users don't share, or where users have deep domain expertise that builders don't fully account for. For products selling into utilities, industrial operations, or enterprise procurement processes with multi-year approval cycles, that gap does not just create friction. It extends sales cycles, stalls pilots, and gives incumbent tools a durability they shouldn't have.
User research is the method that closes this gap. It's the systematic study of how target users behave, what motivates them, and where they struggle, providing evidence to drive design decisions instead of internal assumptions.
This guide reflects what we've learned running research for climate tech and deep-tech products across multiple engagements. It covers the core methods, the research process, common mistakes, and the tools that work in practice for teams without dedicated research operations. If you're a product lead or researcher working on products for regulated industries, complex enterprise environments, or technical operators, this is written for you.
2. Why user research matters in UX design
The ROI case for user research is well-documented. We'll cover the numbers because they matter for internal justification, but the more important argument for climate tech teams is about risk reduction in complex sales environments, not just unit economics.
2.1 Exceptional return on investment
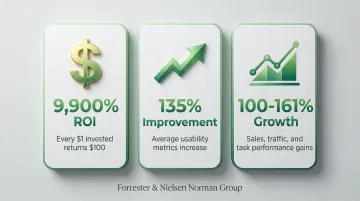
According to Forrester research, every dollar invested in UX brings $100 in return, translating to a 9,900% ROI. An analysis of 42 website redesigns showed usability metrics increased by 135% on average following user research activities, with specific improvements including:
- Sales and conversion rates: 100% increase
- Traffic and visitor counts: 150% increase
- User task performance: 161% increase
2.2 The 1:10:100 rule of cost savings
Research dramatically reduces expenses by catching problems early. Nielsen Norman Group found that fixing a usability issue during design costs 10 times less than fixing it during development, and 100 times less than fixing it post-launch.
In climate tech contexts, the cost multiplier is sharper than in consumer software. When a deep-tech company discovers three months post-launch that energy operators cannot locate manual override controls in their grid monitoring tool, fixing that navigation flaw requires a development sprint, a retraining process, and a credibility problem with a utility buyer whose procurement team is watching the rollout closely. Caught in a prototype session before development, the same issue is an afternoon of design work.
For products in regulated environments or with long enterprise sales cycles, post-launch fixes are not just expensive in development hours. They can reset procurement timelines or trigger compliance reviews. Research that runs early doesn't just reduce costs. It protects deals that are already in progress.

2.3 Risk reduction and product success
Research mitigates the risk of building products that miss the mark. A B2B site case study demonstrated that research-driven information architecture changes led to an 85% increase in product findability.
For technical products where buyers need to self-educate before engaging sales, findability is directly connected to pipeline volume. In climate tech, where buyers often evaluate four to six competing platforms over a six to eighteen month period, the ability of a product to communicate its value during unassisted evaluation is not a nice-to-have.
2.4 Competitive advantage in crowded markets
Companies that conduct regular user research consistently outperform competitors in conversion and retention metrics. In technical B2B markets, embedding UX into product development accelerates time-to-market for new features, reduces customer churn, and creates measurable distance from engineering-led competitors.
The incumbents in energy, utilities, and industrial software have decades of installed base. Their products are often genuinely difficult to use. A product that's easier to evaluate, easier to onboard, and easier to operate within a buyer's existing workflow can close gaps in brand equity that marketing alone cannot bridge. Research is what tells you whether your product is actually achieving that, rather than assuming it does.
2.5 Building team empathy and alignment
Beyond metrics, research builds empathy within teams by exposing everyone to real user struggles and motivations. When developers and stakeholders watch a grid operator or procurement manager struggle with a specific workflow, those observations carry more weight in prioritization conversations than any design brief could.
This shared context also has a direct commercial benefit. When the whole team has watched the same procurement manager struggle with a specific task, the fix gets prioritized, and a product that's been visibly improved based on buyer feedback carries more weight in enterprise evaluations than one that hasn't been through that process.
If you're running research for the first time on a climate tech product and want a starting point for structuring your approach, reach out. We regularly help teams scope their first study and connect it to the product decisions it needs to inform.
3. Types of user research: qualitative vs. quantitative
Understanding the difference between qualitative and quantitative research is fundamental to choosing the right approach. The distinction matters more than usual when your user population is specialized and hard to recruit.
3.1 Qualitative research: understanding the "why"
Qualitative research focuses on direct assessment of usability through observational findings. It identifies which design features are easy or hard to use and, critically, reveals why users behave certain ways.
Qualitative methods include user interviews that surface motivations and mental models, usability testing with think-aloud protocols, field studies that observe users in their natural environments, and ethnographic research that accounts for cultural and contextual factors.
Key characteristics:
- Small sample sizes (typically 5-6 users per user group)
- Rich, descriptive data about user experiences
- Answers "why" and "how to fix" questions
- You use this formatively during design to identify and solve problems
For climate tech products, the value of qualitative research extends beyond finding usability problems. The mental models energy buyers use to categorize products, the terminology they carry from their domain, and the workflows they're already managing are not obvious from the outside. That understanding is what makes it possible to design a product that fits into a buyer's existing context rather than requiring them to adapt to yours.
3.2 Quantitative research: measuring the "what" and "how many"
Quantitative research gathers data indirectly through measurement and instruments, producing numerical metrics you can run statistical analysis on.
Common approaches include large-scale surveys measuring attitudes, analytics platforms tracking behavioral patterns, A/B tests comparing design variants, and benchmark usability testing conducted under controlled conditions.
Quantitative research requires large sample sizes (30+ users for statistical significance), produces numerical data that enables trend analysis, and answers "how many" and "how much" questions rather than "why." You use this summatively after launch to evaluate performance.
One practical note for climate tech teams: recruiting 30 or more domain-appropriate participants for statistical usability studies is genuinely hard when your users are utility operators, grid engineers, or energy procurement managers. This doesn't make quantitative research impossible, but it does mean the path to statistically valid benchmarks often requires more recruiting time and a more specialized panel than general usability studies. Plan for that in your timeline.
3.3 The complementary relationship
The most effective research strategies combine both approaches in what's called mixed-methods research.
Qualitative methods uncover insights and identify problems. Quantitative methods validate those insights at scale and measure their magnitude.
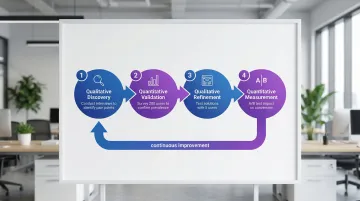
Typical workflow:
- Qualitative discovery: Conduct interviews to identify pain points
- Quantitative validation: Survey 200 users to confirm prevalence
- Qualitative refinement: Test solutions with 5 users
- Quantitative measurement: A/B test impact on conversion
This combination is what allows you to move from "we think users struggle with X" to "we observed 6 users struggling with X, and 78% of survey respondents reported the same issue." That level of specificity is what gets research findings acted on in product planning sessions.
4. Essential user research methods
Each research question calls for a different method. For technical products with complex user workflows, the kind common in climate tech, energy software, and industrial applications, the choice of method matters more than it might in simpler consumer contexts. Buyers in these categories bring domain expertise of their own, and research needs to meet them at that level of specificity.
4.1 User interviews
One-on-one conversations that generate new knowledge about user experiences, needs, and pain points. User interviews explore motivations, frustrations, and mental models that can't be observed directly.
Treat each session as a formal research study rather than a casual conversation. Open-ended questions, such as "Tell me about the last time you...", surface richer responses than yes/no formats. Avoid leading questions that suggest desired answers, and aim for the 80/20 ratio: listen far more than you speak.
For climate tech and industrial software, the most useful interviews push past surface preferences into operational context. Understanding how a grid operator manages shift handovers, or how a procurement manager builds a vendor comparison for a capital expenditure, reveals the real constraints your product needs to fit within. That context almost never surfaces in a product requirements document.
Best for: Discovery and empathize stages when you need to explore user problems before designing solutions. The language and mental models you capture in interviews also sharpen your sales conversations. When you understand precisely how your buyer describes their problem, you can position your product against it with specificity that's hard to achieve through guesswork.
4.2 Usability testing
Participants perform specific tasks while you observe, revealing friction points and confusion in real-time.
Qualitative usability testing: Use the think-aloud protocol so users speak their thoughts aloud while working through tasks. Testing with just 5 users is enough to surface approximately 85% of usability issues. The goal is to observe behavior rather than opinion, capturing specific problems to fix.
Quantitative usability testing:
- Strictly controlled conditions without think-aloud (it slows users down)
- Requires 30+ users for statistical significance
- Captures metrics like task completion rates and times
- Benchmarks performance against competitors or previous versions
Use when: Design and test stages to identify and fix friction during iterative development, or post-launch to measure performance. Usability data also gives you something concrete to show enterprise evaluators: not just claims about ease of use, but evidence that real users in comparable roles completed specific tasks without needing support.
4.3 Surveys
Quantitative measures of attitudes through closed-ended questions that gather feedback at scale.
Keep surveys short to maintain completion rates. Use them for categorizing attitudes or collecting self-reported data, and combine rating scales with optional open-ended questions where you need qualitative context. Prioritize only essential questions to avoid survey fatigue. The longer the survey, the lower the completion rate and the less reliable the final responses.
Ideal for: When you need to validate hypotheses with large samples or track satisfaction metrics over time. For B2B products with long sales cycles, common in energy, utilities, and industrial software, surveys can also help identify which aspects of the product experience are influencing renewal decisions before those conversations happen.
4.4 Field studies and ethnography
While surveys capture attitudes at scale, field studies reveal what users actually do in context. Observing users in their natural environment uncovers real-world workflows and friction points that no interview or survey can fully replicate.
Minimize interference to capture authentic behavior, and combine direct observation with contextual interviews when the opportunity arises. Document environmental factors that affect how the product is used. Pay particular attention to workarounds: the improvised solutions users create when the product doesn't meet their needs. Those workarounds are often your most commercially significant finding.
In a field study we conducted for a grid monitoring software client, operators had created a color-coded sticky note system on their physical monitors to track equipment status the software wasn't surfacing clearly. The system had been in place for over a year. The operators had never mentioned it in interviews because they'd stopped thinking of it as a workaround. It was just how they worked. That observation led to a persistent status indicator redesign that reduced operator error rates during shift handovers. No survey would have caught it.
Best for: Discovery and strategize stages to find unmet needs and opportunities in users' actual contexts.
4.5 Card sorting
Users organize information items into groups, revealing their mental models and informing information architecture.
Types: Open card sorting lets participants create their own category names. Closed card sorting asks them to organize items into predefined categories.
Best practices: Test with 15-30 users for stable structure, use the results for navigation and content hierarchy decisions, and analyze patterns in groupings rather than individual responses.
For climate tech products, card sorting regularly surfaces a specific problem: products are organized around how engineers categorized features during development, not around how buyers categorize their problems. In a card sorting study we ran for a climate analytics platform, procurement managers grouped features under "regulatory reporting" and "operational optimization." The product's navigation used engineering-defined categories that mapped to neither. Restructuring the navigation around the procurement mental model improved trial-to-paid conversion in the following quarter.
Use during: Explore and design stages when structuring navigation or content hierarchies.
4.6 A/B testing
Randomly assigning users to different design variants to measure which performs better.
Best practices: Test one variable at a time for clear causation, ensure you have sufficient live traffic for statistical significance, run tests long enough to account for weekly patterns, and measure business metrics rather than just clicks.
Ideal for: Launch and optimization stages to validate design choices and improve conversion with live users. The data A/B testing produces, specific percentage lifts in trial-to-paid conversion or feature adoption, carries weight in internal review processes where multiple stakeholders need to sign off on a buying decision.
5. The user research process: step-by-step
Effective research follows a systematic process that turns questions into findings you can act on.
5.1 Define research goals and questions
Start by articulating what you need to learn and why it matters.
Condense stakeholder concerns into clear problem statements like "Users cannot find product instructions" rather than vague goals like "improve the experience."
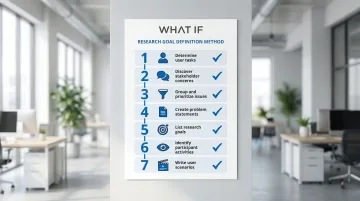
Seven-step method:
- Determine important user tasks
- Discover system aspects of concern to stakeholders
- Group and prioritize issues
- Create specific problem statements
- List research goals for each statement
- Identify participant activities to observe
- Write realistic user scenarios
Connecting each research goal to a specific commercial outcome, a pilot conversion, a renewal decision, a reduction in onboarding time, also makes it easier to report back concretely on what changed as a result of the research.
5.2 Choose appropriate research methods
Select methods based on your research questions, timeline, resources, and product development stage.
By development stage:
- Strategize (discovery): Field studies and interviews to find opportunities
- Design (explore/test): Card sorting and usability testing to improve designs
- Launch (assess): Benchmarking, A/B tests, and analytics to measure performance
Resource considerations:
- Limited timeline: Expert reviews, quick interviews, unmoderated testing
- Limited budget: Guerrilla testing, online surveys, existing analytics
- Comprehensive resources: Mixed-methods combining qualitative and quantitative
The method you choose also affects how defensible your findings are when stakeholders push back on design decisions. Data from controlled usability tests is harder to dismiss than team intuition, and that distinction matters when a sales conversation is driving a product prioritization debate.
5.3 Recruit participants
Find and screen users who represent your target audience. Participant quality directly impacts your findings.
Sample size recommendations:
| Method | Sample size | Rationale |
|---|---|---|
| Qualitative usability testing | 5 users per group | Uncovers approximately 85% of problems; diminishing returns beyond 5 |
| User interviews | 5-6 users initially | Continue until saturation (no new themes) |
| Quantitative usability | 30+ users | Required for statistical significance |
| Card sorting | 15-30 users | Needed for stable information architecture |
Recruiting best practices: Match participants on relevant characteristics like behavior and usage frequency, not just demographics. Use screener surveys to filter for specific traits, overrecruit users with accessibility needs for inclusive design, and compensate everyone fairly for their time. For B2B products in regulated or enterprise markets, recruiting participants who match your actual buyers, by role and decision-making context, means your research findings will hold up when a procurement team questions whether the product was validated with users like them.
5.4 Conduct research sessions
Run your research plan while minimizing bias and maintaining rigor.
Facilitation guidance:
- Create comfortable environments where participants feel safe being honest
- Avoid leading questions that suggest desired answers
- Use neutral prompts: "What do you think about this?" instead of "Don't you think this is clear?"
- Observe behavior, not just what participants say they would do
- Take detailed notes or record sessions (with permission)
The three biases most likely to compromise your sessions are confirmation bias (seeking only evidence that supports existing beliefs), social desirability bias (participants answering to please you rather than tell the truth), and leading (influencing responses through how you phrase questions). Sessions that surface genuine friction, rather than confirming what you already believe, give you the specific evidence you need to address issues before your product reaches a high-stakes enterprise evaluation.
5.5 Analyze and synthesize findings
Once you've completed your sessions, transform raw data into meaningful insights and prioritized recommendations.
Analysis techniques:
- Affinity diagramming: Collaboratively cluster findings to identify patterns
- Thematic analysis: Systematically identify recurring themes across qualitative data
- Statistical analysis: Calculate metrics like task success rates, time-on-task, and satisfaction scores
Synthesis process: Identify patterns across multiple participants rather than individual outliers, develop insights that explain why those patterns exist, prioritize recommendations by impact and implementation effort, and link findings to business outcomes like revenue, retention, and support costs.
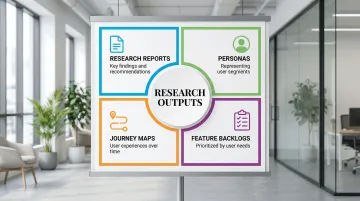
Deliverables:
- Research reports with key findings and recommendations
- Personas representing user segments
- Journey maps showing user experiences over time
- Prioritized feature backlogs based on user needs
Research only creates commercial value when findings connect directly to product decisions that get implemented. Build your deliverables to answer a specific question that a product or commercial decision depends on.
In a recent engagement with an energy storage client, usability testing revealed that the onboarding flow assumed familiarity with battery management terminology that procurement buyers didn't carry, even though operators did. The product was being evaluated by both groups, and the flow was failing one of them without anyone noticing. Separating the onboarding path by role improved enterprise evaluation completion rates measurably. That finding came from a five-user qualitative session. The team had been aware of "some onboarding friction" but hadn't been able to locate it specifically enough to act on it.
If you're working through findings from a recent research round and need help connecting them to product decisions, that's a conversation worth having early rather than after the report is filed.
6. Common user research mistakes to avoid
Even experienced researchers make these mistakes. Knowing them in advance won't make you immune, but it will help you catch them earlier.
6.1 Leading questions and confirmation bias
Leading questions prompt specific answers, skewing your data. "What do you think this button does?" implies it does something specific, causing users to guess rather than respond naturally.
- ❌ Leading: "How much do you love this feature?"
- ✅ Neutral: "What's your reaction to this feature?"
- ❌ Leading: "Was this process easy?"
- ✅ Neutral: "How would you describe that process?"
Confirmation bias occurs when researchers value information confirming existing beliefs while dismissing contradictory evidence. If you only highlight users who preferred your design while ignoring those who struggled, you're falling into this trap.
In practice, confirmation bias is particularly hard to catch because it often feels like pattern recognition rather than bias. When you've worked on a product for months, you develop strong intuitions about what works, and those intuitions will unconsciously direct your attention during sessions toward observations that confirm them. A useful check: after each session, write down two or three things the participant did that surprised you or contradicted your expectations. If you can't find any, you may not be looking hard enough.
To avoid these biases, write your questions in advance and review them for leading language, have a colleague critique your discussion guide before the session, actively seek disconfirming evidence while you're in the room, and report all findings, not just those that support your hypothesis. Biased research produces a false sense of confidence, one that often surfaces at the worst moment: when an enterprise buyer runs their own evaluation and finds friction your internal testing didn't catch.
6.2 Researching the wrong users or too small a sample
This is the most specific and damaging mistake we see in climate tech product teams, so it deserves a direct statement: do not recruit your pilot customers as research participants.
The "5-user myth" applies to qualitative usability discovery, not to quantitative studies, interviews, or statistical benchmarking. Using 5 users for quantitative metrics produces unreliable results because the margin of error at that sample size is too high to draw conclusions about broader user populations.
But beyond sample size, there's a more fundamental problem in technical markets: recruiting users who are accessible rather than users who are representative. The engineer on your advisory board, the friendly contact at a pilot customer, the product manager at a company that's already bought in: these people are easy to reach, but they're not typical users. They understand your product's context, tolerate more complexity, and are often invested in your success. Research with them will produce feedback that's more forgiving than what an average evaluator would give, which means you'll systematically underestimate the friction real users encounter.
We've seen this pattern in energy software engagements repeatedly. A team runs research with their pilot operators, who are sophisticated, motivated users who've already cleared the initial learning curve. The next wave of buyers, evaluating the product cold, encounters friction the research never surfaced. The team is surprised. The pilot operators weren't.
Recruit based on relevant behaviors, not just demographics. Include users with varying skill levels and accessibility needs. Avoid convenience sampling unless those participants genuinely match your target buyer profile, not just your current customer list.
6.3 Confusing what users say with what they do
Users are generally poor predictors of their own behavior. In interviews and surveys, they describe an idealized version of their workflow: the way they'd like to work, or the way they think they should work. Observation-based methods frequently tell a different story.
A user might report that they always review documentation before using a new feature. Analytics show most skip it entirely. A user might say they want more data density in a dashboard. What you observe is that they rarely scroll past the first screen.
This is one reason combining qualitative and quantitative methods matters, not just for statistical validation, but because each approach catches different types of error. Interviews and surveys capture stated behavior. Usability testing and analytics capture actual behavior. When these diverge, the observed data is almost always more reliable.
The practical implication: treat what users tell you they want as a hypothesis to test, not a brief to execute. Design based on observed struggles, not stated preferences. This gap between stated and observed behavior tends to become most visible at the pilot stage, when users who aren't invested in your success encounter the product under realistic conditions and behave differently from what your interviews predicted.
6.4 Research without action
The most common failure mode is conducting research that never influences decisions. Studies fail to demonstrate impact when insights sit in reports without post-implementation tracking.
To ensure your research drives decisions:
- Tie research goals to specific decisions upfront
- Present findings to decision-makers, not just designers
- Write specific recommendations, not just observations
- Track metrics after implementing changes to prove impact
- Build a measurement plan showing how you'll evaluate outcomes
The practical standard: research is complete only when you can point to a metric that changed after implementation. Task completion rate, time-on-task, support ticket volume, trial-to-paid conversion, whatever your product's relevant indicators are. Without that loop closed, the work remains a hypothesis.
7. Tools and resources for user research
Rather than an exhaustive directory, what follows is what actually works in practice, particularly for technical B2B product teams running research without a dedicated research operations function. The short recommendation: start with the minimum stack that covers recruitment, analysis, and one testing method. Add specialized tools only when you have a clear gap that justifies the overhead of maintaining another platform.
7.1 Research and recruiting platforms
UserTesting: Unmoderated and moderated usability testing with think-aloud research. Access diverse participant panels for quick feedback on prototypes and live products. Useful for getting directional feedback quickly, though if you need tight control over participant profiles for a specialized B2B persona, panel quality can be inconsistent. Better suited to initial discovery rounds than high-stakes validation studies with specific user criteria.
User Interviews: Participant recruitment from a 6M+ panel. Key features:
- Screener surveys with logic branching
- Automated scheduling and calendar sync
- Integrated incentive distribution
- For climate tech and deep-tech B2B recruiting, this is typically the most reliable option when you need engineers, procurement managers, or operations professionals that general panels can't reliably source
dscout: Mobile diary studies capturing in-context moments over days or weeks. Participants record video responses in their natural environment, making it one of the few tools that can capture authentic use patterns rather than lab behavior. Worth using when you suspect research sessions aren't reflecting how users actually work day-to-day, or when the product is embedded in a physical workflow that's hard to replicate in a standard session.
7.2 Analysis and collaboration tools
Dovetail: Centralized research repository storing transcripts, tags, and insights. If your team runs research regularly and struggles to track what's already been learned, Dovetail solves the institutional memory problem. Teams can search across 100+ interviews to surface patterns and avoid duplicating research that's already been done.
Miro: Digital whiteboard for affinity diagramming and synthesis workshops. Works especially well when you want non-researchers, developers, product managers, founders, to participate in synthesis rather than just receive a finished report. Shared synthesis sessions tend to produce faster buy-in on findings than a slide deck delivered after the fact.
Airtable: Flexible database for tracking participants across multiple studies. Create custom views to filter by demographics, track incentive payments, and link interview recordings to participant profiles.
7.3 Prototyping and testing tools
Figma: Industry-standard design tool for creating interactive prototypes. Real-time collaboration lets designers iterate during user sessions based on immediate feedback.
Maze: Unmoderated usability testing with quantitative metrics:
- Heatmaps showing where users click
- Task success rates and completion times
- Misclick analysis and user paths
- Direct integration with Figma prototypes
The quantitative output is useful for building the case for design changes in organizations that require data-backed decisions, and for benchmarking improvements across design iterations.
UsabilityHub: Rapid testing for early-stage concepts. Run five-second tests, first-click tests, and preference tests to validate designs before building prototypes. Results are typically available within hours, useful for quick directional checks before committing to a design direction.
8. Putting research into practice
The methods and tools above are well-established. The harder part is building a research practice within a team that's moving fast, often without a dedicated researcher on staff.
For climate tech and deep-tech products specifically, the argument for early research is stronger than it is in most other software categories. Your user population is specialized and hard to recruit. Your buyers operate in regulated environments where design errors can carry compliance consequences. Your sales cycles are long enough that a poor user experience during an early evaluation can eliminate your product before a buyer ever speaks to your sales team.
The temptation is to treat research as something to add later, once the product is more mature. That's typically when the friction becomes hardest to reverse. Assumptions get embedded in the architecture. Workflows get built around internal logic rather than user behavior. The cost to correct them climbs as the codebase grows.
We work with technical product teams at climate tech and deep-tech companies to establish research-informed design processes from early stages. The work ranges from scoping a first study to restructuring a product's information architecture based on how buyers actually categorize their problems. If your product experience hasn't been tested with users who match your actual buyers at your current stage, that's a concrete starting point. Reach out to start that conversation.
9. Frequently asked questions
9.1 What is UX design and research?
UX design covers all aspects of user interaction with products and services, from interface to overall experience. UX research systematically studies users through qualitative and quantitative methods to understand behaviors, needs, and motivations that inform design decisions.
9.2 How do UX designers do user research?
Designers conduct research through interviews (exploring user needs), usability tests (observing task completion), and surveys (measuring attitudes at scale). Methods depend on research questions, timeline, and product development stage.
9.3 What is the 80/20 rule in UX?
The Pareto Principle in UX suggests that 80% of users typically use 20% of features. Research helps identify which features matter most so you can prioritize development resources accordingly. Rather than building everything, focus on the features users rely on most and optimize those for the greatest impact on satisfaction and engagement.
9.4 What are the 4 C's of UX design?
The 4 C's framework defines consistency (predictable patterns across the interface), continuity (seamless transitions across devices and sessions), context (adapting presentation and function to the user's current situation), and complementary (using each platform's native strengths rather than fighting them). User research is what tells you whether your product is actually delivering on these principles for your specific users in their specific contexts, rather than assuming the design intent translated into real-world experience.