Most redesign pitches never answer that. They lead with mood boards, color palettes, and competitor screenshots, then wonder why finance stalls the sign-off. A payback timeline finance teams can actually evaluate does the opposite: it turns a design decision into a numbers decision, which is the language budget owners speak.
This guide gives you the formula, a worked example, benchmarks by business type, and a section built specifically for companies with long sales cycles, like climate tech and deep tech, where a single conversion event can be worth more than a thousand typical B2B leads combined.
TL;DR: key takeaways
- Payback period = total redesign cost ÷ monthly incremental gross profit. The point when cost becomes pure return
- Healthy payback falls between 4 to 12 months; past 18 months signals a scoping problem, not a bad channel
- Focused redesigns ($20K, $50K) pay back fastest; enterprise rebuilds take longer but compound over years
- Payback measures time-at-risk, not total return, pair it with ROI% for a complete business case
- Climate tech and long-cycle B2B should reframe payback around pipeline and partnership value, not conversion rate alone
1. Payback period (and why it matters more than roi%), in one paragraph
Payback period answers one question: how many months until a website redesign's incremental gross profit equals what you spent building it? Cross that threshold, and every dollar the new site generates afterward is pure upside, not cost recovery.
The formula:
Payback Period (months) = Total Redesign Cost ÷ Monthly Incremental Gross Profit
Simple on paper. The denominator is where most teams get it wrong.
1.1 Use gross profit, not revenue
Revenue growth looks great in a slide deck. It's the wrong number here because it ignores what it actually costs to deliver that revenue.
A $500 order at roughly 20% margin returns $100 in real cash; at roughly 60% margin, that same order returns $300. Use gross profit (revenue minus delivery cost) so payback reflects cash actually recovered, not top-line vanity growth.
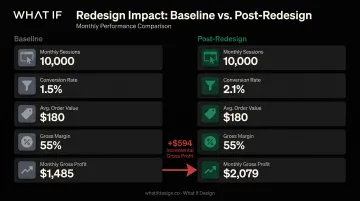
A simple illustrative example:
| Metric | Baseline | Post-Redesign |
|---|---|---|
| Monthly sessions | 10,000 | 10,000 |
| Conversion rate | 1.roughly 5% | 2.roughly 1% |
| Avg. order value | $180 | $180 |
| Gross margin | roughly 55% | roughly 55% |
| Monthly gross profit | $1,485 | $2,079 |
Incremental gross profit: $594/month. On a $12,000 redesign, payback lands around 20 months, slower than most teams want, which is the point. The math forces an honest conversation before launch, not after.
Payback isn't a stand-in for ROI% or IRR. Investopedia defines payback period as the time needed to recover an investment, with no universal cutoff. What's acceptable depends on investment type, industry, and risk tolerance.
Payback tells you when risk ends. ROI tells you the size of the prize once it does. A complete business case needs both numbers side by side.
2. How to calculate your own website redesign payback period (step-by-step)
2.1 Establish your pre-redesign baseline
Before touching a single pixel, capture 30-90 days of clean data:
- Monthly sessions by channel
- Conversion rate by page, not just a site-wide average
- Average deal or order value
- Gross margin per conversion
Skipping this step is the single most common reason teams can't later prove, or disprove, whether the redesign worked. Without a baseline, "it feels better" is the only argument left standing.
2.2 Estimate a realistic conversion lift
Don't pick one number and defend it. Build three scenarios: conservative, expected, and optimistic.
Anchor the conservative case in real evidence, not hope. CXL's documented Walmart Canada redesign produced a 20% overall conversion increase and a 98% jump in mobile orders. That's a strong result, but a single case, not an industry average.
Baymard's checkout research separately estimates up to 35% potential lift from fixing checkout usability alone. That's a modeled opportunity, not a guaranteed outcome.
Treat named case studies as proof of what's possible, not what's typical. A conservative estimate should sit well below either number, often 5-roughly 10%, until your own data says otherwise.
2.3 Total the true project cost
Most teams under-count this by half. List every bucket:
- Design and development
- Content production and copywriting
- Internal team review hours across marketing, sales, and leadership
- Technology or CMS migration costs
- Post-launch optimization and QA
A $38,000 agency invoice, roughly the industry average, can easily become $55,000-$60,000 once internal hours and content production are counted honestly. Skip this step and your payback period looks better on paper than it performs in reality.
2.4 Run the formula against each scenario
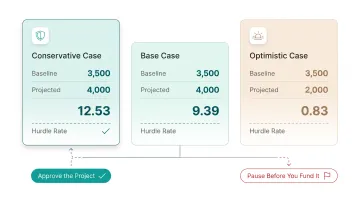
Plug baseline and projected numbers into the formula for all three scenarios, and lead with the conservative case. That's the one stakeholders will actually trust.
| Scenario | Total Cost | Baseline Monthly Gross Profit | Post-Redesign Monthly Gross Profit | Incremental Gross Profit | Payback |
|---|---|---|---|---|---|
| Conservative | $35,000 | $8,000 | $9,200 | $1,200 | 29 months |
| Expected | $35,000 | $8,000 | $11,500 | $3,500 | 10 months |
| Optimistic | $35,000 | $8,000 | $14,000 | $6,000 | 5.8 months |
If the conservative scenario clears your hurdle rate, approve the project. If only the optimistic case works, the business case rests on hope rather than evidence, pause before you fund it.
Our take (from actually doing this)
Reading twenty articles on website redesign payback period will give you the same five bullet points repeated in different fonts. Here's what actually moves the needle when we're inside a real engagement:
- The best decision is rarely the option with the lowest sticker price, it's the one that costs the least to change when your product or funding position shifts in six months.
- Founders consistently underweight the communication tax: how much of your week you'll spend re-explaining what you're building. The right partner should reduce that tax, not add to it.
- The only reliable way to de-risk this decision is to look at what a partner has actually shipped for teams like yours, not what they say they can do.
That's why our own recommendations lean toward specialists over generalists for climate and deep-tech work. If you want to pressure-test your specific situation, book a strategy call, 25 minutes, no pitch, and we'll be direct about whether we're the right fit.
3. Payback period benchmarks: what counts as "good" by business type
If your site hasn't kept pace with where the business actually is, we can show you what that's costing you. Get a free strategic audit.
Most well-executed redesigns pay back within 4 to 12 months. Projects stretching past 18 months usually point to a scoping or execution problem, not a weak channel.
Typical windows by business type:
- E-commerce: 3 to 6 months
- B2B SaaS / lead-gen: 4 to 12 months (measure from close, not form-fill)
- Local / professional services: Often faster when client LTV is high
- Climate / deep tech: Track pipeline velocity before monthly revenue
3.1 B2B SaaS and lead-generation sites
B2B conversion rates start low. First Page Sage's 2026 industry data puts B2B SaaS average conversion around 1.roughly 1%, with adjacent sectors like environmental services (1.3%) and biotech (1.8%) not much higher. A lift from 1.1% to 1.5% looks small on paper, but it can materially increase lead volume.
The catch is timing. According to Databox's B2B sales cycle research, over 30% of companies surveyed take 1-3 months to close after first contact, and most take longer than two months. Payback should be measured from close date, not form-fill date, or you'll think the redesign underperformed when it's simply early.
3.2 E-commerce
E-commerce sees the fastest payback of any category, mostly from volume rather than dramatic percentage lifts. Adobe reports average conversion rates between 1% and 4%, with 3.65% cited as a common benchmark.
On a high-traffic store, even a modest lift compounds daily. With instant transaction data, payback periods of 3 to 6 months aren't unusual for well-scoped e-commerce redesigns.
3.3 Local and professional services
This category benefits from a low starting point paired with high customer value. Unbounce's landing-page data puts professional-services median conversion around 6.roughly 1%, though many local business sites start well below that.
When one new patient or case is worth thousands in lifetime value, payback often arrives faster than raw traffic numbers suggest.
3.4 Climate tech, deep tech, and long-sales-cycle B2B
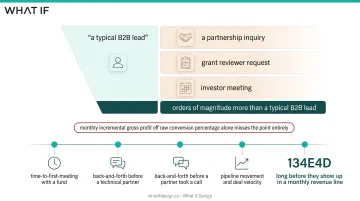
Here the formula holds, but the inputs change. A single conversion event: a partnership inquiry, grant reviewer request, or investor meeting, can be worth orders of magnitude more than a typical B2B lead. Modeling monthly incremental gross profit off raw conversion percentage alone misses the point entirely.
Payback in this category is better tracked through pipeline movement and deal velocity: did the redesign shorten time-to-first-meeting with a fund? Did it reduce the back-and-forth before a technical partner took a call? Those shifts show up in the pipeline long before they show up in a monthly revenue line.
4. Why payback looks different for climate tech and deep-tech websites
Climate tech and deep-tech companies rarely convert on checkout buttons or contact forms. Their sites convert on trust signals aimed at investors evaluating a fund thesis, government grant reviewers weighing technical merit, and enterprise partners deciding whether to bet a pilot budget on unproven technology. None of that fits a standard conversion-rate box.
That changes what belongs in the payback numerator. A "conversion" might be:
- A warm introduction request from a climate VC
- A grant reviewer spending three extra minutes on a technical page instead of bouncing
- An enterprise procurement team forwarding the site internally before a pilot conversation
The Department of Energy's published merit-review criteria focus on technical and scientific merit, completeness, and program priorities, not website design. But founders don't pitch in a vacuum. A site that fails to translate complex science into a clear story makes the human evaluator's job harder, whether or not that's an official scoring line.
4.1 Unclear design is the real risk
The brief itself is hard to write because the underlying science is complex. A redesign can use a great font, load fast, and still fail at its job if it doesn't get the technical value across clearly enough to move a funding or partnership decision forward.
This is the problem What if Design was built around. The team works with founders across carbon capture, green hydrogen, and grid technology, translating dense science into brand and website narratives a fund partner or grant reviewer can follow. That work has contributed to more than $105 million raised across clients backed by the US Department of Energy, ARPA-E, and climate-focused venture firms.
In practice, that looks like:
- Susteon: Interactive diagrams explained its CO2-capture-to-fuel process instead of jargon, and qualified career applicants rose 30% after launch
- LabStart: A rebrand that made lab-to-market pathways understandable to non-scientist stakeholders
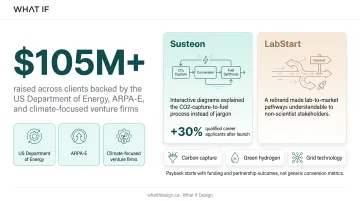
For this category, payback conversations should start with funding and partnership outcomes, not generic conversion metrics.
5. Factors that shrink or stretch your payback period
Three variables move your payback number more than anything else.
Starting point sets the ceiling. A site converting at 0.roughly 5% has enormous room to improve quickly. A site already at roughly 4% in a category where the benchmark tops out around 4-roughly 6% has far less headroom, no matter how good the redesign is.
Cost accuracy determines whether your number is real. Teams that count only the agency invoice, skipping content production, migration, and internal review hours, consistently understate their true payback period. The redesign isn't cheaper because you didn't count the whole bill.
Post-launch discipline turns a one-time win into a compounding one. A documented 30/60/90-day plan tracking conversion rate, page-level engagement, and lead quality shows what to keep and what to fix.
Without that cadence, most sites plateau within weeks. Treat the redesign as an ongoing practice, not a single event, or you hit payback once and stall.
Clarity here is what turns a defensive conversation into a confident one. Get a free strategic audit.
6. Frequently asked questions
6.1 How much will it cost to redesign a website in 2026?
Website redesigns typically range from the low five figures for a focused UX and conversion refresh to six figures for a full brand-and-website rebuild. The right number depends on scope matched to business stage, not a fixed industry rate.
6.2 How long should a website redesign take?
A focused refresh can run 4-8 weeks, while a full rebuild with migration often takes several months. Rushing the discovery phase is the most common way teams damage their payback numbers later.
6.3 How often should a website be redesigned?
Technology and buyer expectations shift every 3-5 years, but the better trigger is hard signals: plateaued conversion, a fragile CMS, or a sales team avoiding the site.
6.4 What is a good payback period for a website redesign?
4-12 months is the commonly accepted healthy range. Focused projects often pay back faster, while enterprise rebuilds take longer but compound in value over a multi-year horizon.
6.5 How is payback period different from ROI?
Payback measures the time it takes to break even; ROI measures total return generated over a set period. A complete business case needs both figures, not just one.
6.6 Does payback period apply to climate tech and B2B companies with long sales cycles?
The formula still applies, but what you count as return changes. Model it around pipeline value, partnership conversions, or funding outcomes instead of simple lead volume.
Related reading: Why UX failures cost climate and deep-tech startups credibility and B2B website UX.
Ready to take the next step?
If you're weighing a design partner for climate, deep tech, or hard-to-explain products, Book a strategy call with our founders at What if Design, a no-pressure 25-minute conversation about what you're building and where design can help. You can also View our work to see how we've helped teams like yours, or Get a free strategic Audit of your current brand, website, or product experience.