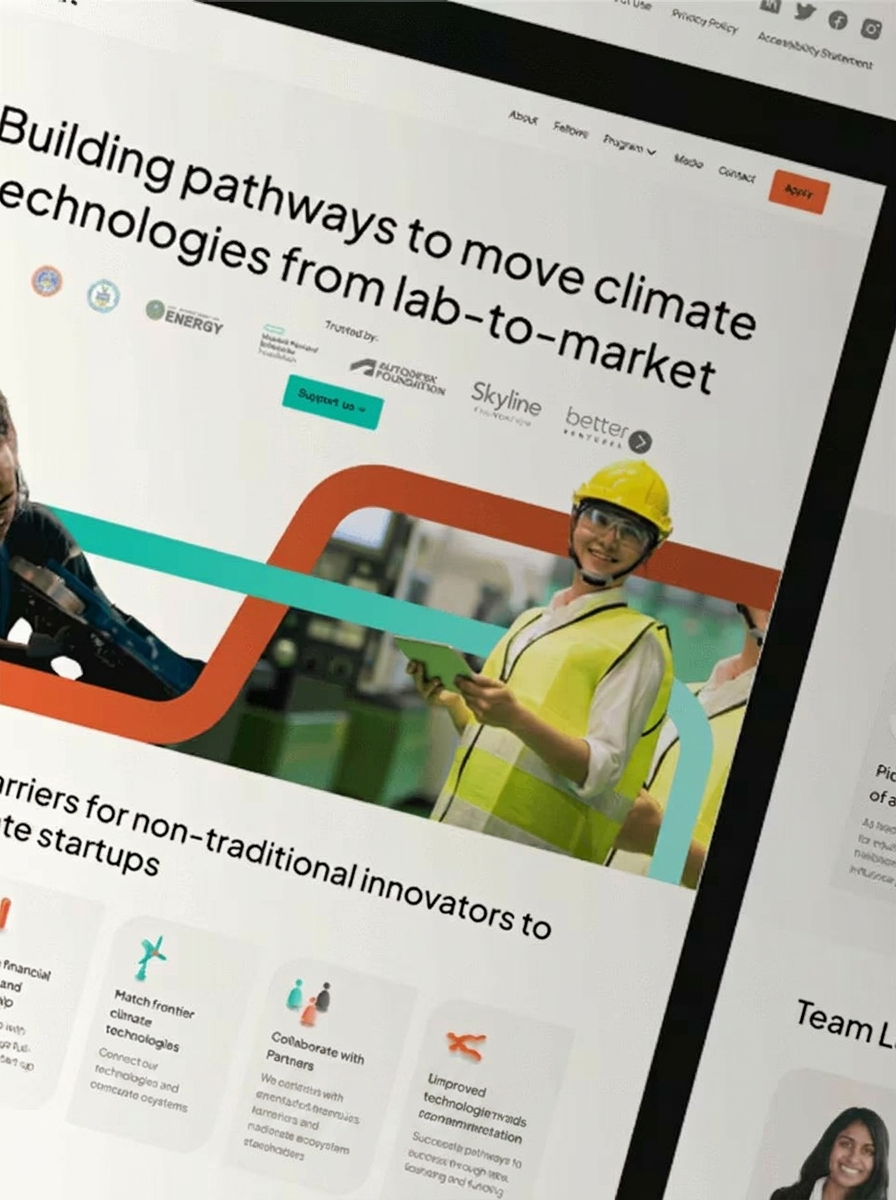
Dashboard UX Design
Map user journeys, information architecture, and workflows for climate risk dashboards used by technical, executive, and operational audiences.
Turn complex climate hazard data into clear, decision-ready dashboard experiences. What if Design helps climate and sustainability teams structure risk information, design intuitive data visualizations, and create interfaces that support confident action. From hazard layers and scenario comparisons to stakeholder workflows, we make technical climate intelligence easier for executives, analysts, operators, and partners to understand and use.

Trusted by industrial leaders worldwide













Design strategy, interfaces, workflows, and interactions that make complex hazard data clearer for real-world decisions.
Map user journeys, information architecture, and workflows for climate risk dashboards used by technical, executive, and operational audiences.
Create clear dashboard interfaces for hazard layers, climate indicators, scenario comparisons, and other technical information that users need to interpret confidently.
Design purposeful states, filters, transitions, and interactive patterns that help users explore climate hazard information without losing context.
Climate risk dashboards often combine technical models, geographic information, scenarios, and uncertainty. We organize those inputs into focused experiences that help each audience find the right signal, understand its significance, and move toward a decision. Our team brings climate technology expertise, systems thinking, and business-outcome prioritization to interfaces designed for clarity, adoption, and trust.

Explore design thinking shaped by complex climate, energy, sustainability, and deep-tech challenges.
"Working with What If has been transformative — faster feature roll outs, reduced development costs, and a fantastic user experience. They quickly understood our vision and offered proactive ideas"

Senior design expertise for complex climate technology products and decision-making tools.
The firm focuses on climate tech, energy, hard-tech, and sustainability initiatives.
Founders apply architectural systems thinking to complex products and information structures.
Work directly with senior founders without the overhead of in-house hiring.
Design decisions connect user needs with strategic goals and measurable business outcomes.
Founders and senior designers translating complex climate technology into clarity.


Co-Founder, Lead Design Strategist
Akhila is the co-founder and lead strategist at What if Design. She helps climate tech companies turn complex science into brands and websites that close funding and partnerships. She has worked with teams backed by the US Department of Energy, ARPA-E, leading climate VCs across carbon capture, grid interconnection, and green hydrogen, contributing to over $105M raised. Founders trust her because she learns the science and market before designing, and translates what they build visually for effective communication.

Co-Founder, UX Design Lead
Tejas is the co-founder and product UX lead at What if Design. He leads product and UX for software companies, designing for adoption, retention, and the metrics that drive growth. His work spans battery management systems, fleet platforms, and ESG tools, plus enterprise software for the Ministry of Health of Saudi Arabia. Founders trust him because he treats every screen as a business decision, not just a design problem.
Climate risk dashboard design is the process of organizing hazard data, scenarios, indicators, maps, and supporting context into an interface people can understand and use. It combines user experience, information architecture, data visualization, and interaction design. The goal is not simply to display more data, but to help technical and non-technical audiences identify relevant risks and make informed decisions.
Talk with the team about your data, users, and decision-making goals.
Share your dashboard goals, users, data challenges, and current product materials so the team can discuss a focused design approach.
You can also send us a quick email at team@whatifdesign.in.
You can also send us a quick email at team@whatifdesign.in.