
Visual clarity and seamless collaboration without losing data integrity
Redesigning Cleantech Group's flagship reports
How we transformed the design workflow for industry-defining research reports, giving their global team real-time collaboration and cutting revision cycles by half.
TIMELINE
12 month engagement across overlapping report cycles (ongoing)
Challenge
Flagship reports needed fresh visual design and a production workflow that could handle data density, overlapping deadlines, and multiple contributors without fragmented review cycles.
Impact
- Revision cycles cut from 5+ rounds to 2-3
- Analysts now have direct visibility into design as it happens
- Single source of truth replaced PDF email chains
- Design system scales across reports and consulting deliverables
The Opportunity
Cleantech Group has been the leading authority on cleantech innovation since 2002. Their flagship reports, including the Global Cleantech 100, have shaped investment decisions for corporations, investors, and governments worldwide for 16 years.
But two constraints were limiting their impact. The reports needed fresh design to match an ongoing brand refresh. And the production workflow kept analysts in the dark until late in the cycle, with charts cycling through five or more revision rounds before alignment.
With three major reports scheduled across consecutive months, they needed a design partner who could:
- Translate complex market intelligence into visually compelling reports
- Create data visualizations that communicate clearly without oversimplifying
- Build templates that handle dense data without sacrificing clarity
- Give analysts direct visibility into the design process
- Reduce friction and revision cycles across global time zones
Without it, every report launch would repeat the same bottlenecks.

The Impact
The new design system and workflow became Cleantech Group's foundation for producing flagship reports that match the quality of their research.
- Consecutive report launches delivered:50 to Watch and LATAM 25 hit their October and November dates, with design keeping pace as content arrived in waves across time zones.
- Revision cycles shortened:Analysts verify visualizations while they're being built. Design reviews now resolve in 2-3 rounds.
- Analyst visibility restored:Research team comments directly on their sections in Figma, seeing how their data is being visualized throughout the process.
- Collaboration centralized:One Figma workspace holds all reports. The team comments, reviews, and resolves feedback in place.
"I like all your treatments of the data. It's different than what we do. You show data in really cool ways and I think that's what attracted me to your company in the first place. You've made all these elements come together to help us elevate what we're offering."

Sarah O'Connell
Director, Events and Programs, Cleantech Group

Scope
Tools


How we delivered
We built a design system for the reports and a collaborative workflow that handles complexity without bottlenecks.
- Design exploration:We created mood boards with multiple layout directions before committing to full design. This aligned all work with their simultaneous brand refresh and prevented costly revisions across three overlapping reports.
- Data translation:We turned dense market intelligence into clear visual stories. Investment trends, company maps, value chains, and sector analyses all designed to communicate without oversimplifying the research.
- Scalable system:We built the design language on the first report and carried it through the next two. The same approach extended to 4 PowerPoint templates for internal and client use.
- Workflow transformation:We replaced PDF email chains with a shared Figma workspace where analysts comment directly on their sections. Design reviews that cycled 5+ times now resolve in 2-3 rounds.

More Work
View all work
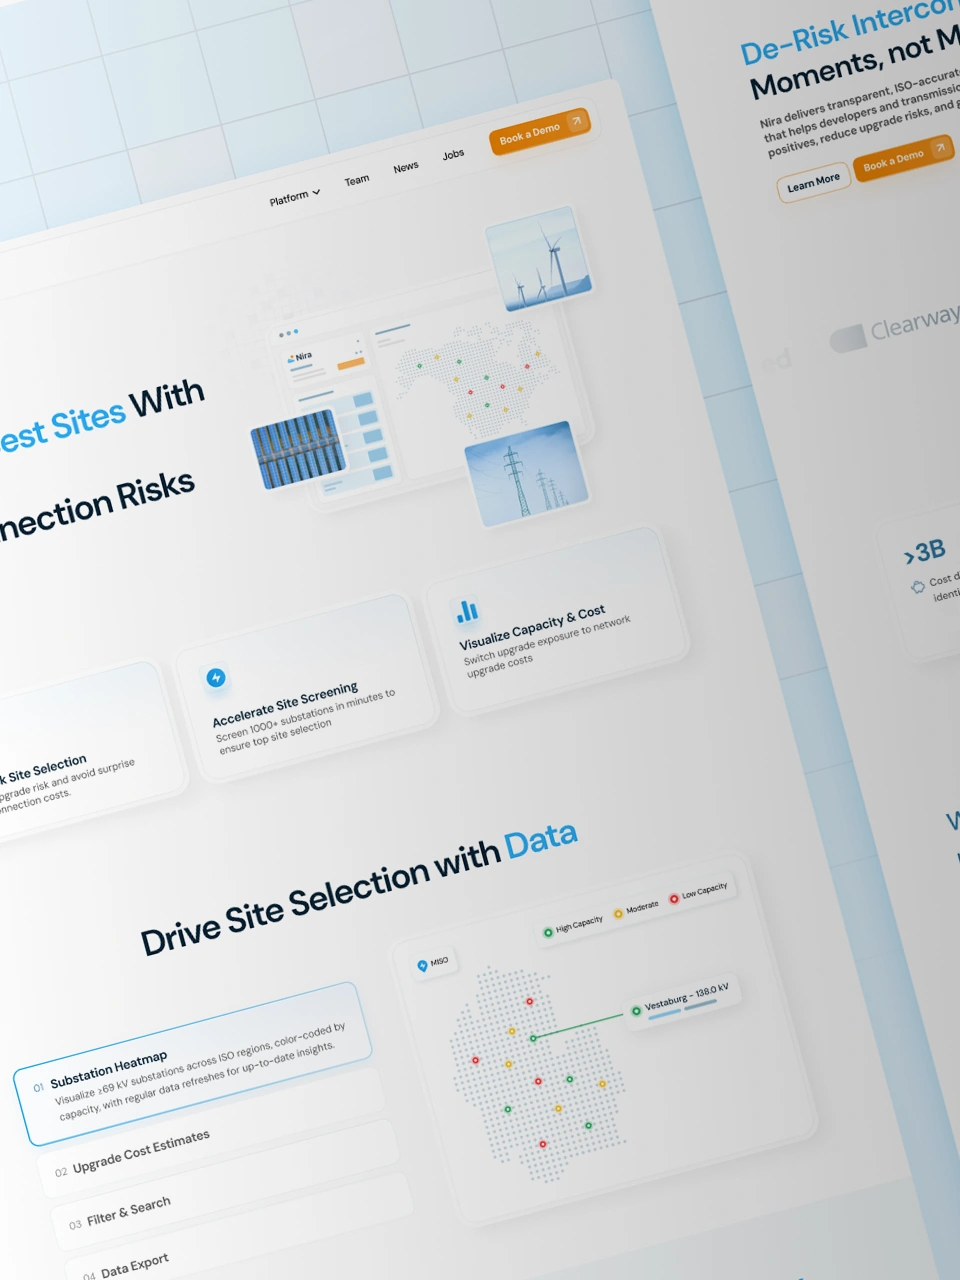
Nira Energy
View project
Powering smarter clean energy connections

Cleantech Group
View project
Elevating research for cleantech leaders
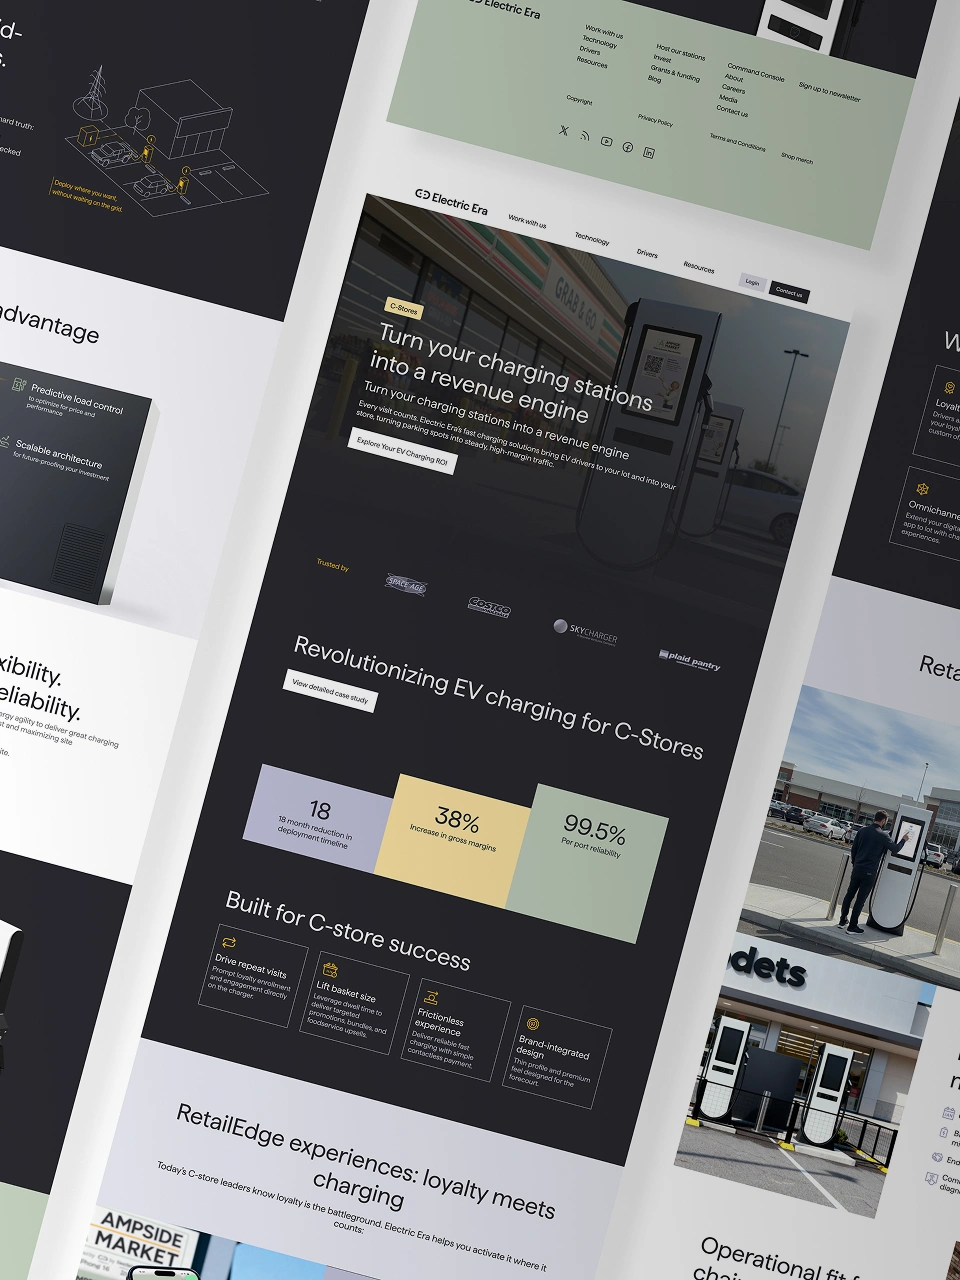
Electric Era
View project
Scaling EV charging for every retailer

HYDGEN
View project
Powering on-site clean hydrogen adoption
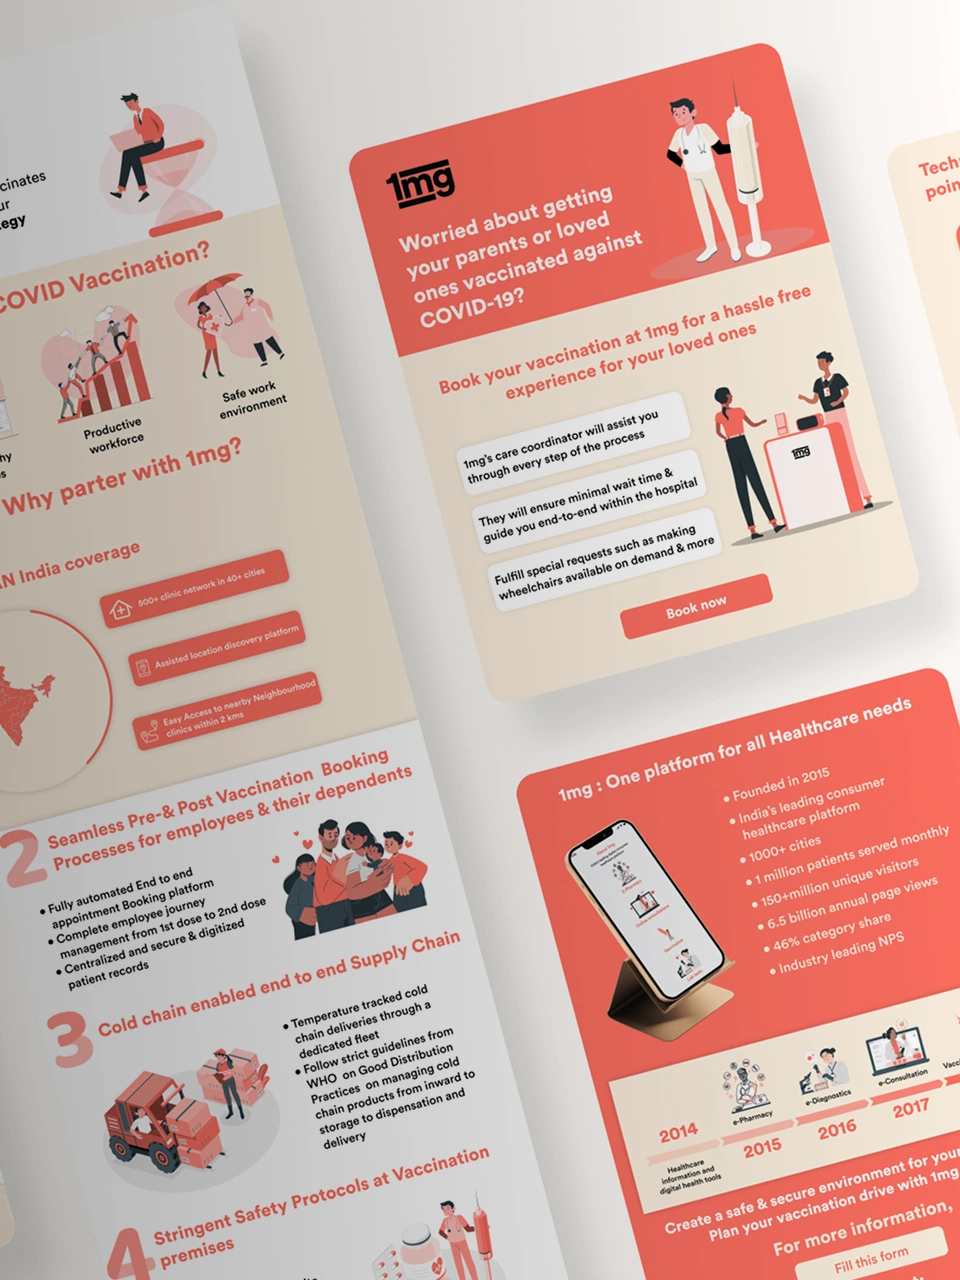
TATA 1mg
View project
Driving COVID vaccinations across India

Ministry of Health, KSA
View project
Enterprise software for hospitals
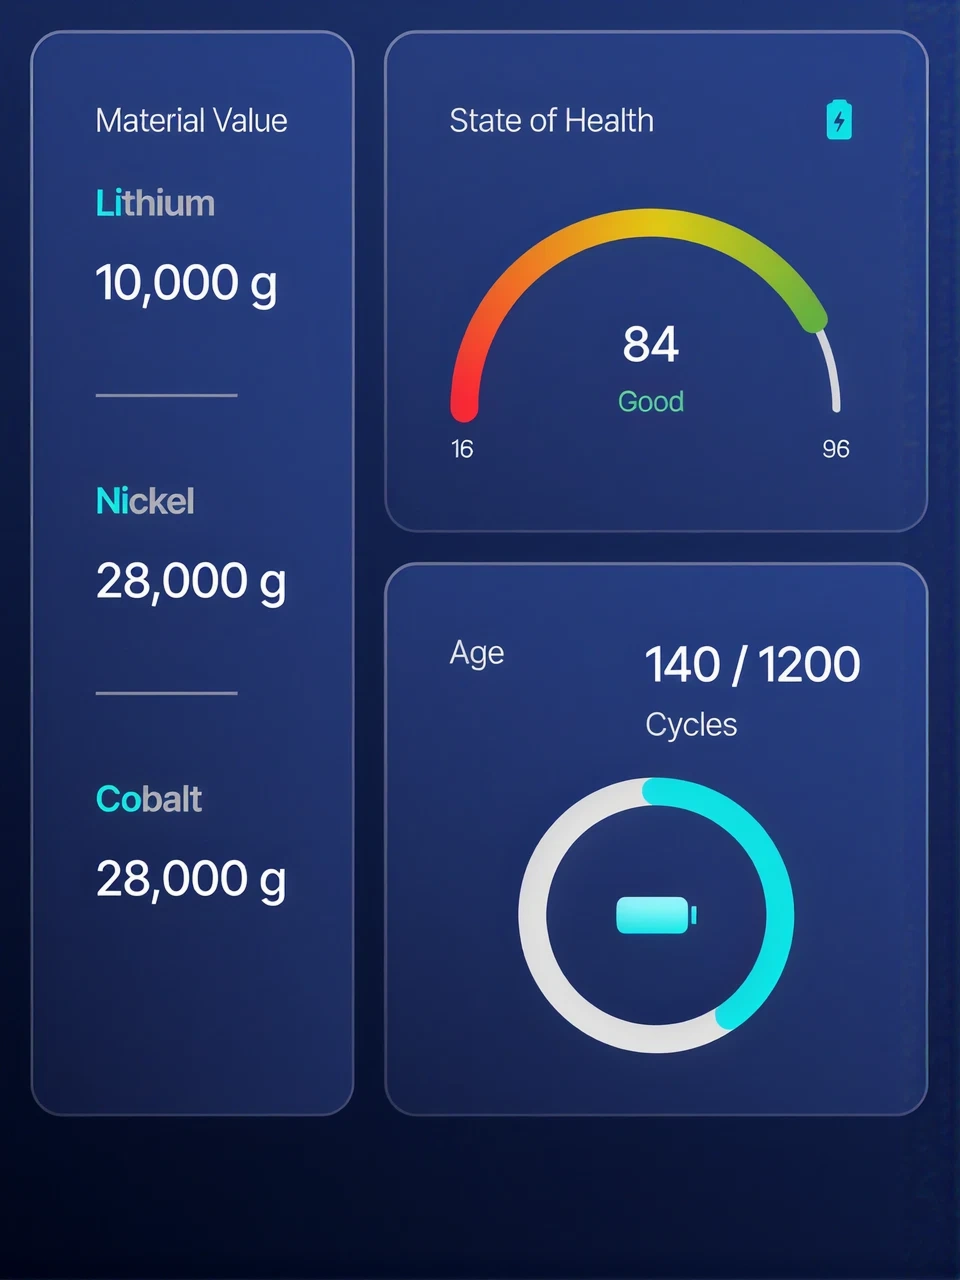
Batteryze
View project
Creating a circular EV Battery economy
Does your research deserve better design infrastructure?
Book a 15-minute clarity call. We'll discuss your current workflow and you'll leave with perspective on what's possible, whether we work together or not.
Schedule a call